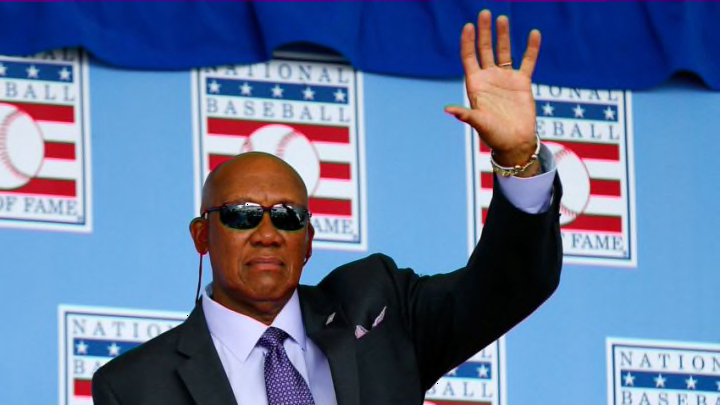
Much has been made of the Chicago Cubs’ starting pitching so far in 2018. But let’s take a trip down memory lane and revisit Fergie Jenkins.
The Chicago Cubs’ dominant starting pitching ultimately led to a World Series title two years ago. After a busy offseason, fans are hoping the rotation can again lead the Cubs to the promised land. With pitching on the mind, let’s look at one of the team’s all-time greats.
From 1967 to 1972 Jenkins won 20+ games, averaged over 300 innings per year and posted a 3.00 ERA, a 1.072 WHIP and FIP of 2.77. In addition, Jenkins threw 140 complete games in those six years, an average of 23 per season. In that span he walked just 378 batters (49 intentionally) and struck out 1,490 batters, a strikeout-to-walk ratio of almost 4:1.
Imagine how eye-popping his numbers might have been if he only had to pitch six innings per game and 200 innings per season. So let’s hop in the time machine and take an in-his-prime Jenkins to 2017.
More from Cubbies Crib
- Cubs should keep close eye on non-tender candidate Cody Bellinger
- Cubs starting pitching has been thriving on the North Side
- Make no mistake: the Cubs are very much about power hitters
- Cubs are giving pitcher Javier Assad a deserved shot
- Cubs: It’s time to start thinking about potential September call-ups
To do that we reduce his innings per game to six, what most pitchers are expected to produce today, and see where we’d land. I’m only doing this with one season, his 1971 season, because it’s a lot of manipulation of stats to do all six years, and you’ll get the idea anyway.
Test case number one
In 1971, Jenkins went 24-13. He pitched in 39 games and went the distance 30 times. So that’s our first challenge since no pitcher today comes close to completing 30 games. Complete game leaders among the top pitchers in 2017 who threw more than 200 innings are Ervin Santana (5), Cory Kluber (5), Carlos Martinez (2) and Max Scherzer (2).
We start by throwing out games the Cubs lost after the sixth inning where Jenkins had a lead up through the sixth inning, and games the Cubs won after the sixth inning when Jenkins was behind. We assume these games were lost or won after Jenkins would have been pulled.
Jenkins would be 21-9 over those same 39 starts with nine no decisions. But no one gets 39 starts anymore because of the five-man rotations now commonly used (our four comparison pitchers averaged 31.5 starts in 2017). That’s about 20 percent fewer starts so let’s take that off Jenkins’ totals and we get…17-7. That makes him better in terms of win-loss record in 2017 than all of our test cases except Kluber.
And among the 2017 Cubs starters, he’d be here:
Jenkins 17-7
Lester 13-8
Arrieta 14–10
Another metric to utilize
Another data point we can reasonably rely on is FIP, which is a better representation of a pitcher’s performance than ERA or win-loss record. I compared the same four pitchers and for two, Kluber and Martinez, I used career FIP since their time in MLB play is short, and for Santana and Scherzer I used the same ages, 24 to 29, as Jenkins’ 1967 to 1972 seasons with the Cubs.
FIP
Jenkins 2.77
Kluber 2.93 (2.84 using Kluber’s top seasons)
Martinez 3.52
Santana 4.45
Scherzer 3.40 (2.90 using Scherzer’s top seasons)
Jenkins has a better FIP between the ages of 24 and 29, pitching over 300 innings per season and completing on average 23 games each season, than the two best pitchers in 2017, Kluber and Scherzer, who won their respective League Cy Young awards.
And in case you’re wondering, Chris Sale led all of MLB in FIP in 2017 at 2.45, his career best. Jenkins’ 1971 FIP? 2.13
Of course, there’s a lot more to consider in a comparison like this, such as how would Jenkins fare against today’s hitters? Add your thoughts on those issues and see if we still land in the same place. Thanks for reading and go Cubbies!
