Chicago Cubs: Projecting Kris Bryant’s 2018 Season

(Photo by Stacy Revere/Getty Images)
1 of 3
Next
(Photo by Stacy Revere/Getty Images)
(Photo by Stacy Revere/Getty Images) /

Many say the Chicago Cubs’ Kris Bryant had an “off year” in 2017. In reality, he improved in a number of statistical categories despite a slight decrease in slugging numbers. What does he have in store for 2018? More greatness.

Last year was pretty odd regarding evaluating the Chicago Cubs‘ Kris Bryant. He came off a 2016 in which he was the National League MVP and a World Champion. The expectations were sky-high for the young kid in 2017 as many thought he could repeat as NL MVP in just his third year in the majors. Despite finishing seventh in the vote and not being named an MLB All-Star, he still had a darn good season.

More from Cubbies Crib

Yes, the “Bryant had a down year” statement has been said numerous times, but the numbers have to be explored fully. There are certainly some statistical categories he did not match or exceed in 2017. However, there are some areas which he did better in 2017 vs. 2016.

Here are stat lines comparing Bryant’s 2016 and 2017. Information from Fangraphs.

2016:

.292/.385/.554 with a .939 OPS/ 39 HR / 10.7% BB / 22.0% K / .332 BABIP / 3.2 UBR (Ultimate Base Running) / 148 wRC+ / 10 Defensive Runs Saved / 11.0 Defensive Value / 8.3 fWAR

2017:

.295/.409/.537 with a .946 OPS / 29 HR / 14.3% BB / 19.2% K / .334 BABIP / 4.8 UBR / 146 wRC+ / 2 Defensive Runs Saved / 2.3 Defensive Value / 6.7 fWAR

Bryant may not have had the overall Wins Above Replacement value he had in 2016, but 6.7 is still pretty darn good. It was third-best in the National League. The defensive metrics were not as high in 2017 which factors into overall value, but the batting stats tell different stories.
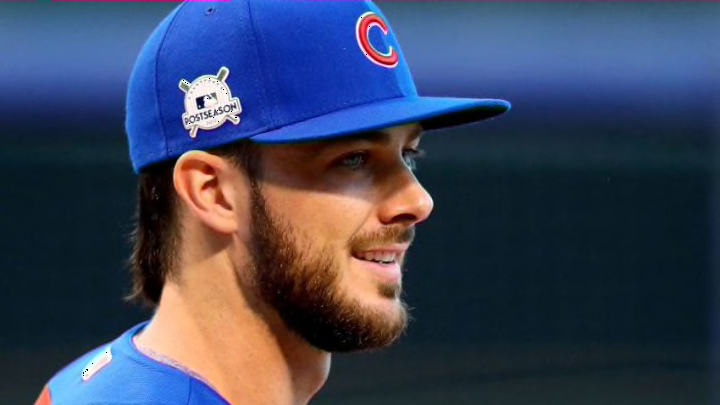
(Photo by Stacy Revere/Getty Images)
(Photo by Stacy Revere/Getty Images) /

Evaluating Bryant’s at the plate

Though he hit ten fewer home runs and the slugging was slightly down, he improved as an overall hitter at the plate. His on-base percentage rose above .400 as his walk rate rose and his strikeout rate decreased.

Looking at his hit break down (not counting home runs), in 2016 he hit 99 singles, 35 doubles and three triples. In 2017 he hit 91 singles, 38 doubles and four triples. Those are very similar numbers, and his batted balls are finding grass at a similar rate looking at his BABIP numbers.

Keep in mind his BABIP was slightly higher last year while also strikeout out less. Both his in-zone and outside-of-zone contact numbers rose last year, while his swing percentages in both decreased. His swing selection was overall better. And he made more of his choices as he made better contact. It explains both the slight increase in BABIP and decreased strikeouts.

Zone Swing% 74.2 (2016) vs. 68.3 (2017)

Outside-Zone Swing% 30.8 (2016) vs. 28.3 (2017)

Zone Contact% 81.1 (2016) vs. 85.0 (2017)

Outside-Zone Contact% 59.8 (2016) vs. 64.7 (2017)

The “run production” argument is another topic of conversation. Bryant bats in the two-hole and the faulty RBI stat does not factor his position in the order. A good indicator of production is his wRC+ (Weighted Runs Created Plus). 148 (2016) vs. 146 (2017), yes technically down but still very similar and very good.

Overall Bryant’s approach at the plate improved last year and actually, he showed growth in a number of areas.

(Photo by Ezra Shaw/Getty Images)
(Photo by Ezra Shaw/Getty Images) /

Looking ahead to 2018

At age 25 and entering his fourth year, he begins his journey into potential prime years. There is no reason not to think he will keep getting better. This time he has a full offseason to rest and not constantly be in the celebratory spotlight.

His three years in the majors have seen positive trends in his approach at the plate regarding getting on base and striking out less. Since 2015 he has cut his K% from 30.6 to 19.2% and increased his OBP from .369 to .409. His consistency in hitting singles, doubles and triples compliments the increased walks very nicely. The main hope for 2018 is to see the power surge again.

By no means is 29 home runs and a .537 slugging sub-par, but Bryant is capable of doing better. Last year his flyball percentage went slightly down by about 3.4% and his hard contact (defined by Baseball Info Solutions) was also down by roughly 7.5%. It was easy to see last year that he did not drive as many pitches as he did in 2016 despite all the other improvements at the plate. But he can fix that, and he will work to fix it.

Next: Who gets the ball on Opening Day?

There are a number of ways to project a player, many of them mathematically. Just looking at his numbers and knowing his capability, there is every reason to think he can slash another .295/.400/.540+ line next year. If he gets his power back to his 2016 self, he has the capability of hitting 40+ home runs and maybe get his OPS to the 1.000 marker.

There is no reason not to think he won’t in the MVP race again if he is fully healthy in 2018.

Next