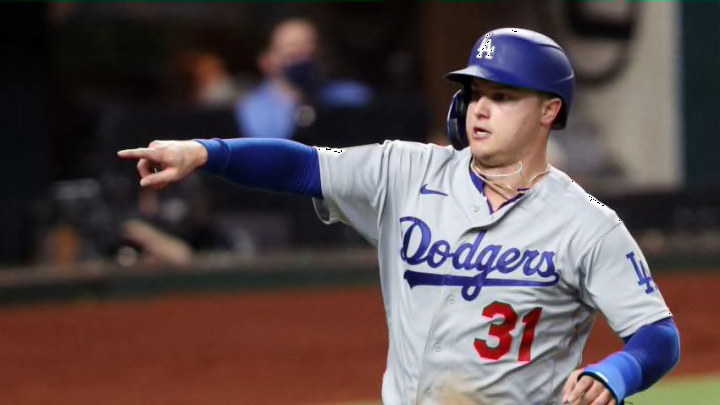
Cubs: biggest similarities between the two players lie in their career numbers
First, to start with the basic career slash-line:
- Schwarber: .230/.336/.480 in 551 games
- Pederson: .230/.336/.470 in 748 games
In the words of Dory from Finding Nemo, “Okay, that’s just scary!” It was easy to imagine that these two players were similar just from their playing styles, but the numbers are insanely identical.
Pederson made his debut in 2014 and Schwarber made his debut in 2015. The difference in games is a little over a season’s worth, but still noteworthy of how the two compare. Now to add a few more career numbers into the mix:
- Schwarber: 121 home runs, .816 OPS, 113 wRC+, 28% K rate, 13% BB rate, .267 BABIP, 9.6 fWAR
- Pederson: 130 home runs, .806 OPS, 118 wRC+, 24.2% K rate, 12.1% BB rate, .257 BABIP, 13.0 fWAR
[Insert identical Spidermans pointing at each other meme here]
Despite similarities, if you had to choose a slightly better player up to this point is is probably Pederson. His wRC+ being slightly higher and his strikeout rate being higher than the league average, but lower than Schwarber. It is pretty accurate to say Schwarber does have the better power stroke considering he has just nine less home runs in less games, but Pederson could also benefit playing on warm days in Chicago than Chavez Ravine and other pitcher-friendly NL West parks. He won’t necessarily hit the titanic Shwarber-like blasts, but Pederson has 30 home run-type power.
There is one more set of offensive numbers to look at:
- Schwarber: 43.8% pull, 31.4% center, 24.7% opposite field – .197 avg. against lefties
- Pederson: 44.9% pull, 34.2% center, 20.9% opposite field – .191 avg. against lefties
It is no surprise both players are heavy pull-hitters to right field. Pederson pulls a bit more so it can explain why his career BABIP is lower, more pulled balls into shifts and less opposite field equals more outs. It is also no surprise that two lefty sluggers who have some holes in their swing struggle against south paws.
