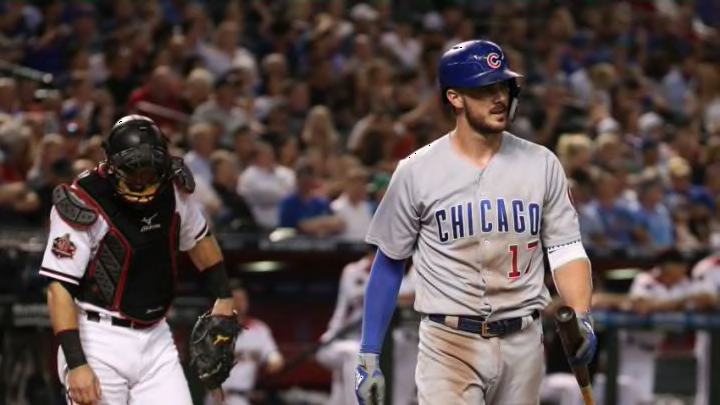
This isn’t how it was supposed to go. Despite a star-studded roster ripe with talent, the Chicago Cubs offense failed to live up to expectations all year long.
While watching the Chicago Cubs’ gut-wrenching Wild Card loss to Colorado, I experienced a wide range of emotions: pride, excitement, frustration, stress and, eventually, heartbreak. But one stat came up that had me utterly disturbed.
The Cubs had the second-most games with one or fewer runs, only in front of the Baltimore Orioles. That’s right – the Orioles. The team that finished with the worst record in baseball at 47-115. The club that finished 61 games out of first place. A group that cleaned house at the trade deadline.
More from Cubbies Crib
- Cubs: P.J. Higgins deserves to be in the lineup on a daily basis
- Cubs might start to limit Justin Steele’s workload soon
- Cubs: Adrian Sampson is forcing his way into the conversation
- Projecting the Chicago Cubs bullpen to open the 2023 season
- Cubs fans are beginning to see the light at the end of the tunnel
I knew that the Cubs offense was extremely inconsistent, but I didn’t realize it struggled to this extent. I decided to dig into some more of the numbers to see if I could make myself feel better.
What do the numbers say?
Overall, the Cubs offense had solid numbers. They ranked ninth in MLB in runs scored (761), 11th in runs per game with 4.65 and fourth in batting average at .258.
Anthony Rizzo and Javier Baez both had over 100 runs batted in. Ben Zobrist finished sixth in the NL with a .305 batting average, showing the Cubs had league leaders and the right components for consistent success. However, something still seemed a little off about this team’s offense and that brings me to my points.
- Runs Per Game Were Down: In 2016 and 2017 combined, the Cubs averaged 4.925 runs per game, which was top 10 in the MLB both seasons. In 2018, it dropped to 4.65, which was 11th in baseball. The offense averaged almost a half run less than they normally do. This may not seem super significant, but it’s enough to raise some eyebrows.
- Runs in Wins Versus Runs in Losses: The Cubs may have scored the ninth-most runs in baseball this year and averaged the 11th-most per game. But when you break it down by wins and losses, it doesn’t look that great. In wins, the Cubs averaged 6.53 runs per game and 2.07 in losses. They scored 620 of 761 runs in wins (82 percent) and 141 of 761 (18 percent) in losses. With just 26 (27 percent) of wins coming in one-run games (13th in MLB), we see when the Cubs won, they blew the doors off other teams. In losses, they had trouble doing anything.
- Games with one run or fewer: This is the biggest issue of them all. As I said, the Cubs averaged 2.07 runs in losses and had 39 games with one run or fewer, second ahead of Baltimore who had 40. 35 of these came in losses. If you count the Wild Card game, that’s 40 games with one run or fewer, 36 losses, and 10 shutouts. This shows the Cubs scored one run or fewer in 52 percent of losses this year. Simply put, that’s a mind-boggling statistic.
We’ve seen the obscurity of the Cubs offense this season, and with just a dash of more consistency, we’d most likely see a third-straight division title and a trip past the Wild Card game. Chicago has a lot to work on this offseason but if they can fix the inconsistency at the plate, continue to develop the young stars and maybe add another bat, we could see the team return to their championship-caliber form.
