Chicago Cubs: Pitching could be this team’s biggest strength in 2018

(Photo by Ezra Shaw/Getty Images)
7 of 9
Next
(Photo by Ezra Shaw/Getty Images)
(Photo by Ezra Shaw/Getty Images) /

The Chicago Cubs rode a strong pitching staff to a championship two years ago. Is this year’s team capable of following a similar path to success?

Note: This is Part III of a three-part series compiling a statistical analysis of the National League Central. The previous installments can be found in links below:

Over the last two days, I’ve laid out a statistical analysis of all five National League Central teams. The Chicago Cubs maintained a sizable advantage behind the plate and in the infield. Meanwhile, the Milwaukee Brewers’ offseason acquisitions put them over the top in the outfield.

Now, we turn to pitching. In the last week, Chicago added free agent starter Yu Darvish, the final touch of a pitcher-centered offseason for Theo Epstein. Former Cub Jake Arrieta remains unsigned and, thus, will not factor into this evaluation.

One more time, here is how we evaluated players for this analysis.

What you need to know

  • Cumulative stats – such as WAR – are expressed as per game averages, unless otherwise noted. This is important to remember for context throughout the article.
  • Per game averages reflect data covering a four-year sample size from 2014 to 2017 (where applicable; obviously younger players with limited service years allow only for review of however many years they’ve had Major League roster time). Using an expanded time scale helps mitigate some of the risk that comes with only assessing the immediate past. Baseball is a sport of trends and consistency where, as the saying goes, water tends to find its level.
  • Because cumulative stats are broken down to their lowest level (per game average), the rankings herein use a “Play Percentage” estimate for each individual likely to take up a roster spot in 2018. That value was used to determine the approximate number of games played for each of those individuals. Through these means, a fairly representative baseline was created which allowed a very linear evolution from per game average to predicted 2018 season-long results.
  • Key sabermetric statistics such as WAR (Wins Above Replacement), UZR(Ultimate Zone Rating), ISO (“ISOlated power” – measure of extra base hitting tendencies), BsR (Base Running measure of additional runs created), FIP(Fielding Independent Pitching), wOBA (weighted On Base Average) and BABIP(Batting Average on Balls In Play) are leaned on heavily.
Photo by Jamie Squire/Getty Images)
Photo by Jamie Squire/Getty Images) /

A blind look at the top NL Central starters

While the prototypical position player is typically easily defined, identifying top pitchers is far less so. Pitching is heavily dependent on external forces that even the best pitchers can’t really control. For that reason, rather than getting all fancy with numbers and formulas, the best approach in assessing pitchers is the simple one: rely on the measure of a players overall contributions to his team’s success.

The charts below lists the top twelve starters in the NL Central, ranked by WAR. Along with WAR, you find a few other statistical elements that can be used to help further differentiate the players. Note that no one thing about pitching can be used to truly predict success.

All too often, this reality creates a model where a pitcher’s name carries more clout than the data. In an effort to combat that “name prejudice”, the rankings below do not include player names or team affiliations. After we digest the numbers a bit, we can get to the names that these numbers represent.

Figure 5: Starting Pitcher Comparison

(Photo by Stacy Revere/Getty Images)
(Photo by Stacy Revere/Getty Images) /

Getting into some newer-era analysis

In case of the pitchers, the cleanest way to apply stats to more meaningful information would be to take the WAR provided and simply multiply by the anticipated number of starts. This becomes useful as you evaluate the relative value of a team’s entire pitching staff. Any time you start looking into numbers like WAR, though, it is critical to remember what the numbers truly mean. Rather than providing a meaningful statistical result, WAR offers a means by which one can compare others within his peer group.

Hold on to your hats

The other numbers shown here (apart from ERA, which we all now fully understand) are quite worth exploring. Both BABIP and FIP provide some insight into if a pitcher’s performance is due to great “stuff” or good fortune. Starting with BABIP – which is presented as a batting average – one can surmise that Pitcher 5 may have overshot his “normal” performance. Because this particular hurler saw batters he faced hit a paltry .247 on balls hit in play, it can be deduced that he benefited from great defense or perhaps a propensity for hitters to hit the ball directly at a fielder.

It should also be understood that it may actually just mean the pitcher has great stuff and pitches to weak contact, which is why bringing FIP into the equation is helpful. Looking at these two numbers together allows one to quickly realize that it is more likely this particular thrower saw solid defense in his starts. Because his actual ERA is far below his FIP number, the analysis is showing he “should have” given up over half a run more per start.

Now that we’ve had a chance to dig into these numbers a bit, let’s circle back and put some names to the numbers:

(Photo by Harry How/Getty Images)
(Photo by Harry How/Getty Images) /

St. Louis headliner – and a lot of Cubs

Figure 6: Starting Pitcher Comparison – with Names

Surprised?

Going into this, I expected the Cubs to grade out well as a unit. But this level of advantage is admittedly stunning. Granted, FIP/ERA (and to a lesser extent BABIP) show a regression is possible. But one should also recognize that regression for all four could still land them at or near the top of the list.

Other factors at play here

Also noteworthy – the top name on this list, Alex Reyes, is recovering from surgery and may not be ready to open the season. Potentially, May or June. And, when he does return, he may pitch out of the bullpen – according to MLB.com.

Related Story: Who reigns supreme when it comes to position players?

Beyond the Cubs being so well represented at the top of this list, notice the Cardinals have five players listed here. This speaks to their upside and historic consistency, and again, stands up to rational thought. It should be noted that Jimmy Nelson of the Brewers and Chicago’s Drew Smyly, though injured, were included in the assessment but neither fell within the top 12.

Rather than draw further conclusions at this point, let’s present the total season WAR predicted for each team, based on 162 games and balancing the starts across the constellation of likely 2018 rotation pieces. This process took into account the injured starters and prorated their likely starts against what has been reported (in regards to their eventual availability) through various outlets.

(Photo by Jamie Squire/Getty Images)
(Photo by Jamie Squire/Getty Images) /

Cubs, Cardinals headline rotations entering 2018

Figure 7: Starting Pitcher Comparison – 2018 Projected WAR

This should remove any lingering questions there may be on the subject of starting pitching. Chicago’s rotation is markedly better than the other four in the division. Meanwhile, St. Louis is significantly better than the third-place staff in Milwaukee. You also notice just how poor – relatively speaking – Cincinnati’s starting arms are. The good news for Reds fans is they have enough youth to have this low WAR estimate based more on not having enough good information on the players than actually not having any good arms.

To circle back to an earlier point, let’s talk Milwaukee. These numbers are another contributing factor to my less bullish take on the Brewers than what others see. Milwaukee had clear needs at catcher, middle infield and in their rotation. Instead, they prioritized Lorenzo Cain as their main free agent acquisition.

(Photo by Jonathan Daniel/Getty Images)
(Photo by Jonathan Daniel/Getty Images) /

One man head and shoulders above the rest

To keep this explanation brief, relief pitchers are handled exactly like starters for the purposes of this exercise. Please note: closers are not included among this list. They have their own category due to the nature and importance of the role.

Figure 8: Relief Pitcher Comparison

The chart for relief pitchers shows two key factors: there is one reliever in this division whose statistical measures put him head and shoulders above all others. But for that one player, the balance of the relief ranks are grouped together quite consistently.

Further analysis is also very telling in there is a very large difference between BABIP for several players on this list. This is not atypical of relievers. Often there are great fluctuations in this sort of category, particularly since many relievers have such limited exposure that even one sub-par outing can skew their numbers significantly.

Onto the reveal:

(Photo by Stacy Revere/Getty Images)
(Photo by Stacy Revere/Getty Images) /

Bullpen rankings also loaded with Cubs

Figure 9: Relief Pitcher Comparison – with Names

Well, once again the net results may be somewhat unexpected. There isn’t much debating that Milwaukee’s Hader is, in both performance-to-date and raw stuff, right where he should be on the list.

Solid relief

Brett Cecil is a long time effective reliever so his presence at the top isn’t surprising either. But to have the next five on the list be Cubs is something I wouldn’t have expected. In fact, the Cubs are the only team to have more than three players ranked in the top 12 (they have five such players). It’s hard, then, not to anoint this unit the best in the division as well. Even if it will draw the ire of those who are firmly aboard the Brewer-train or reside in Cardinal Nation.

Related Story: A statistical analysis of the National League Central

Since it is nearly impossible to effectively estimate how many games each reliever will pitch, creating a team total for reliever’s WAR would be wasted motion and wouldn’t tell a particularly compelling story. Back-of-the-napkin math will further reinforce that Chicago has the edge here, at least until St. Louis signs Greg Holland to close and adds Gregerson to their general bullpen population.
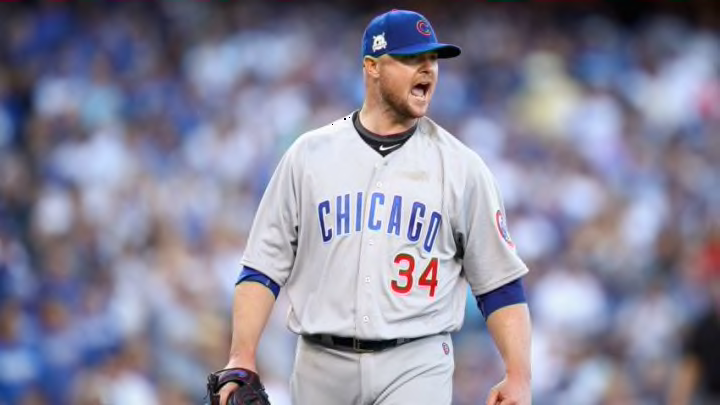
(Photo by Ezra Shaw/Getty Images)
(Photo by Ezra Shaw/Getty Images) /

Getting the ball in the ninth inning

The final position group that is left to be assessed could well be the most critical to a team’s ability to win games, particularly close games. Comparatively speaking, the NL Central is not known for its great closers, but, truth be told, the division actually features a very impressive stable of firemen. Ranking closers is no easier than ranking the other pitchers, but similar to how unique position groups like catchers are assessed, understanding closer value requires a review of some very specific information.

To this end, the table below provides supporting information that informs on key closer attributes: control of the strike zone, ability to minimize solid contact (measured through FIP and comparison to FIP and ERA), ability to prevent home runs (always unfortunate in a late game situation), previous experience as a closer and overall contribution to team success (as measured through WAR).

Figure 10: Closer Comparison

A dream scenario, to be sure

I will admit it, this one is tough for even me to swallow. While smart money has Morrow being a solid closer – particularly if he continues to dominate as he did in 2017 – this just doesn’t feel right, at least not at first. However, the more you think about, the better sense it does make. Iglesias, Knebel, Rivero each have only one full season under their belts as closers, so their experience isn’t leaps and bounds ahead of where Morrow is. While Morrow wasn’t asked to close games out, he certainly did pitch in some very big situations, so it stands to reason he will be able to handle the pressure aspect.

(Photo by David Banks/Getty Images)
(Photo by David Banks/Getty Images) /

What we’ve learned

The only thing left to do here, really, is to put a fine point on something I suspect anyone who is being honest with themselves will know anyway:  the National League Central is still the Cubs to lose. We can also check the box that we have validated the Pirates are not going to be very good. Between those extremes, however, there seems to be considerable wiggle room and a handful of very impactful questions.

Will the Brewers find a long-term answer at second base? Will the young Orlando Arcia grow at shortstop to where he can help buoy their top-heavy lineup? Can the Reds start reaping the rewards of having a farm system full of solid pitching prospects who, up until now, haven’t been ready to contribute at the big league level? Would that be enough to catapult them into the Wild Card race?

Can the Cardinals succeed over the full season without a lockdown closer? What, if anything, will the teams behind the Cubs do before and during the season officially kicks off to help level the playing field?

Next: Darvish could become a next-level pitcher in 2018

Which brings me to the very best assertion this article makes:  we will soon find out what happens next, as Spring Training is finally upon us.

Next