Chicago Cubs, Milwaukee Brewers hold respective edges entering 2018

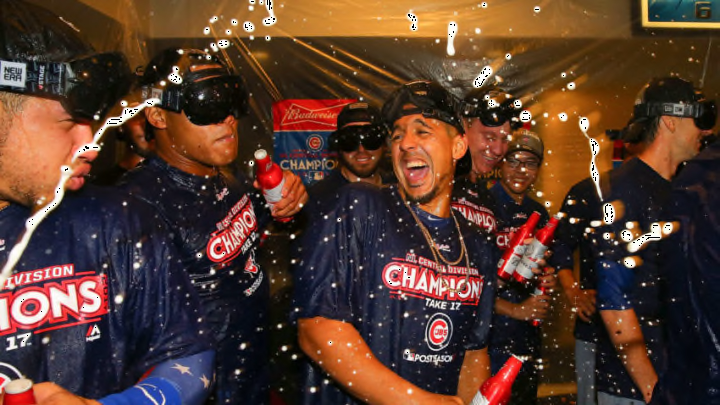
ST. LOUIS, MO - SEPTEMBER 27: Jon Jay #30 of the Chicago Cubs celebrates after winning the National League Central title against the St. Louis Cardinals at Busch Stadium on September 27, 2017 in St. Louis, Missouri. (Photo by Dilip Vishwanat/Getty Images)
4 of 6
Next
CHICAGO, IL – OCTOBER 18: Kris Bryant #17 and Anthony Rizzo #44 of the Chicago Cubs celebrate after beating the Los Angeles Dodgers 3-2 in game four of the National League Championship Series at Wrigley Field on October 18, 2017 in Chicago, Illinois. (Photo by Jamie Squire/Getty Images)
CHICAGO, IL – OCTOBER 18: Kris Bryant #17 and Anthony Rizzo #44 of the Chicago Cubs celebrate after beating the Los Angeles Dodgers 3-2 in game four of the National League Championship Series at Wrigley Field on October 18, 2017 in Chicago, Illinois. (Photo by Jamie Squire/Getty Images) /

One of the Chicago Cubs’ biggest assets? Their incredibly deep, talented position player core. How does this group stack up in the division?

Note: This is Part II of a three-part series compiling a statistical analysis of the National League Central. The final installment goes live on Saturday at 12 p.m. CT.

The Chicago Cubs hold a clear and decisive advantage when it comes to Willson Contreras – and the catching core, as a whole. But one catcher isn’t enough to win a title. All over the diamond, the Cubs have plenty of talent. How does it stack up against their division foes?

Instead of relying on the ‘eye test’ or emotions, I have attempted to put it all in number form. Numbers don’t lie – and they can paint eye-opening pictures for us. Before we dive back into this analysis, a quick refresher on how this is set up.

What you need to know

  • Cumulative stats – such as WAR – are expressed as per game averages, unless otherwise noted. This is important to remember for context throughout the article.
  • Per game averages reflect data covering a four-year sample size from 2014 to 2017 (where applicable; obviously younger players with limited service years allow only for review of however many years they’ve had Major League roster time). Using an expanded time scale helps mitigate some of the risk that comes with only assessing the immediate past. Baseball is a sport of trends and consistency where, as the saying goes, water tends to find its level.
  • Because cumulative stats are broken down to their lowest level (per game average), the rankings herein use a “Play Percentage” estimate for each individual likely to take up a roster spot in 2018. That value was used to determine the approximate number of games played for each of those individuals. Through these means, a fairly representative baseline was created which allowed a very linear evolution from per game average to predicted 2018 season-long results.
  • Key sabermetric statistics such as WAR (Wins Above Replacement), UZR (Ultimate Zone Rating), ISO (“ISOlated power” – measure of extra base hitting tendencies), BsR (Base Running measure of additional runs created), FIP (Fielding Independent Pitching), wOBA (weighted On Base Average) and BABIP (Batting Average on Balls In Play) are leaned on heavily.
(Photo by Jamie Squire/Getty Images)
(Photo by Jamie Squire/Getty Images) /

Again, a level playing field for infielders and outfielders

Whereas catcher allows for a fairly linear evaluation, assessing an infield unit is decidedly more complex. What makes up a good infield depends on what a team values. Hence, it is significantly tied to the makeup of the specific team.

For example, a team with multiple power-hitting outfielders would likely value players on the infield who get on base. Adding more high-homer, strikeout-prone players likely won’t play well. Similarly, if a team has a very poor fielding third baseman, they are more likely to roster a defense-first backup or a shortstop with above-average range.

This being the case, it is important to utilize an assessment methodology for infielders (and outfielders too) that allows for a quantitative result that can be compared to and combined with a broader set of data to represent a more complete picture.

What does it all mean?

In plain English, infield and outfield were assessed separately but in a similar manner. Thus, one can combine the results for a single valuation covering both units.

Within the metrics for this assessment, a premium in value was placed on a player’s overall performance, results at the plate (extra-base hits, on-base average and runs created potential), base running productivity and overall defense.

(Photo by Jon Durr/Getty Images)
(Photo by Jon Durr/Getty Images) /

Cubs, Cardinals lead the pack in terms of infield value

Note the representation of the numbers is in the context of average results per each infielder, however the numbers themselves were derived by assessing the individuals within each team’s position group.

This “normalization” of the data is intended to allow general comparisons that would support determining relative value of, as an example, one of Milwaukee’s outfielders versus a Cubs infielder. For the purposes of rankings, WAR is not factored into the rating but rather is presented for further context around the value of a team’s positional grouping.

Figure 2: Infield Comparison

Breaking it all down

Again, in the “I’m Not Particularly Surprised” department, the Cubs have the edge when it comes to the infield. Since this assessment is more quantitative, one can also deduce that Chicago is roughly 15 percent more productive on the infield than the next-most productive team, the Cardinals. Pittsburgh is far and away the worst of the bunch, which should shock nobody.  The other three slot in about as you would figure they would.

More from Cubbies Crib

One interesting observation stood out with this infield ranking. Teams with elite performers at multiple positions – such as the Reds who feature Joey Votto and Eugenio Suarez on the corners – plugging in average-to-below average players in an effort to maximize budget hurts the overall unit. This is somewhat contrary to a strategy predicated on overpaying superstars and shopping the bargain basement to fill out the roster.

Changing how rosters are built

One can hope the prospect pipeline helps fill team voids with young, cheap talent (as it has in the Cubs case). But teams may be better off to move away from the “one big spend” in favor of securing several players that grade above-average. The example I’ll use here is the St. Louis.

When they lost out on Albert Pujols, ownership decided to not replace him with another high-priced slugger. Instead, they committed to hanging on to their mid-tier players and bringing in similar utilitarian types like Jedd Gyorko. While this approach may impact marketing efforts, the reality is teams that employ such an approach avoid teardowns and rebuilds. We should pay close attention to this trend. It may well be the preferred path as teams employ an analytical approach to roster construction.

/

Milwaukee has a lot to look forward to in the outfield

The outfield units are assessed exactly as the infield units were. The resulting “total rank” is analogous to that same value for infielders. Thus, a comparison both within and across teams is easily understood.

The statistics utilized in this ranking match exactly those used for infielders, so I’ll spare you the repetition.

Figure 3: Outfield Comparison

Milwaukee made a significant financial investment in its outfield this winter. Knowing that, the fact they grade out substantially ahead of the others is to be expected. Chicago, St. Louis and Cincinnati each grade out solidly in the outfield, but for very different reasons.

Above-average – in very different ways

The Cubs parlay surprisingly good overall defensive ratings (they have the highest projected UZR) with solid run production and high on-base potential. The Cardinals make up for poor defensive numbers with superior offensive production while the Reds excel on defense and on the bases but struggle a bit more in producing runs and getting on base with consistency. And hey, look at that, the Pirates grade out as, well, bad.

Part of the “fun” of this lengthy exercise is drawing conclusions that may otherwise go unnoticed. One such conclusion as it relates to outfield is that big names don’t necessarily mean big production.

Related Story: Part I: A statistical analysis of the National League Central

Changing the way we look at the game

Take the Pirates as an example. They feature two outfielders in Starling Marte and Gregory Polanco who, most would tell you, are pretty good players. Yet their sabermetric totals tell a very different story and expose them both as flawed contributors.

While they may fill box scores up with the stats most casual fans relate to, their on-field play is not on par with those with whom they would otherwise compare favorably. This is another key factor in how analytics and sabermetrics – also know as “nerdology” – are changing the way teams are built and redefining the game’s future.

Now that both the outfield and the infield have been discussed, we have the opportunity to present a combined ranking for the five teams.
(Photo by Dylan Buell/Getty Images)
(Photo by Dylan Buell/Getty Images) /

Chicago leaps-and-bounds ahead of the division

Figure 4: Combined Infield-Outfield Comparison

Viewing the findings of this exercise in this context serves as somewhat of a validation of the process. There shouldn’t be much argument that, in ordering the units from best to worst, the list is topped with the Cubs infield with the Brewers outfield.

It may be somewhat of a surprise to view the Cubs outfield as the next-best unit. However, when you consider what sabermetrics truly value – great defense, ability to get on base while still producing runs – you realize that reality may not necessarily match the narrative. Continuing down the list, calling out Pittsburgh’s infield as the worst single unit in the division also turns heads.

As an aside, Theo Epstein’s ability to recognize and understand the value of analytics in developing a roster is clearly evident. It’s these finer points, not big names and gaudy stats, that win you championships. It may explain why Theo has been consistently successful as a general manager, as well.

(Photo by Jonathan Daniel/Getty Images)
(Photo by Jonathan Daniel/Getty Images) /

The numbers speak for themselves

All in all, these numbers make sense and the stories they tell are quite revealing. They show that Cincinnati may not be as far off from contention as many would think. Also, it shows that the few moves the Cardinals made among their position players have yielded a net gain and have them poised to remain viable in the division.

They imply that perhaps Milwaukee would have been better served to address the issues in their infield instead of building to a strength in the outfield. Certainly, the addition of Christian Yelich and Lorenzo Cain certainly help this group. We see this as the Brewers outfield ranks as the second-best position grouping.

But I’m not so sure they wouldn’t have been just as highly-ranked had they just stuck to bringing in Yelich and spent Cain’s money on an infielder (Eduardo Nunez or Zack Cozart). For that matter, even Jonathan Lucroy as a catcher. (In full disclosure, technically the Brewers could add Nunez and/or Lucroy as neither has signed at time of writing).

Next: 2018 rotation could outperform even 2016 staff

Or, better still, they could have invested big in a starting pitcher.

Next