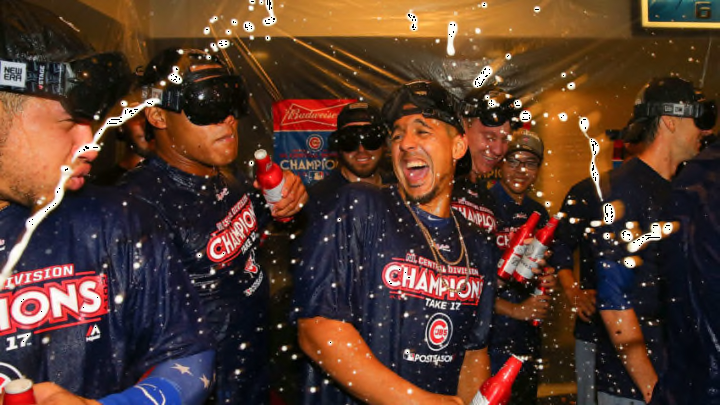
One of the Chicago Cubs’ biggest assets? Their incredibly deep, talented position player core. How does this group stack up in the division?
Note: This is Part II of a three-part series compiling a statistical analysis of the National League Central. The final installment goes live on Saturday at 12 p.m. CT.
The Chicago Cubs hold a clear and decisive advantage when it comes to Willson Contreras – and the catching core, as a whole. But one catcher isn’t enough to win a title. All over the diamond, the Cubs have plenty of talent. How does it stack up against their division foes?
Instead of relying on the ‘eye test’ or emotions, I have attempted to put it all in number form. Numbers don’t lie – and they can paint eye-opening pictures for us. Before we dive back into this analysis, a quick refresher on how this is set up.
What you need to know
- Cumulative stats – such as WAR – are expressed as per game averages, unless otherwise noted. This is important to remember for context throughout the article.
- Per game averages reflect data covering a four-year sample size from 2014 to 2017 (where applicable; obviously younger players with limited service years allow only for review of however many years they’ve had Major League roster time). Using an expanded time scale helps mitigate some of the risk that comes with only assessing the immediate past. Baseball is a sport of trends and consistency where, as the saying goes, water tends to find its level.
- Because cumulative stats are broken down to their lowest level (per game average), the rankings herein use a “Play Percentage” estimate for each individual likely to take up a roster spot in 2018. That value was used to determine the approximate number of games played for each of those individuals. Through these means, a fairly representative baseline was created which allowed a very linear evolution from per game average to predicted 2018 season-long results.
- Key sabermetric statistics such as WAR (Wins Above Replacement), UZR (Ultimate Zone Rating), ISO (“ISOlated power” – measure of extra base hitting tendencies), BsR (Base Running measure of additional runs created), FIP (Fielding Independent Pitching), wOBA (weighted On Base Average) and BABIP (Batting Average on Balls In Play) are leaned on heavily.
